Case Study: Mapping Thirty Years of Work as an Interactive Night Sky
The Firmament: Thirty Years of Creative Work, Mapped as a Night Sky
Self-initiated · 2026 · Information architecture, data visualisation, interaction design, front-end build
A radial constellation map of 1,500+ works across 13 thematic constellations. Every star is a real piece of work. Every line between them is a reading a user can follow. Built entirely in SVG and JavaScript, with no visualization library, and deployed as the front door to a ten-site portfolio.
Works Mapped: 1,500+
Constellations: 13, each named in English and German
Pre-Mapped Authored Paths: 6 readings across the whole corpus
Domains Connected: 8 live sites in a ten-site constellation
Build: Pure SVG and JavaScript. No canvas. No external library
Versions: v3 as a flat radial map. v4 as a rotating globe.
Status: Deployed. The primary navigation layer for the portfolio
Most portfolios are lists. The Firmament is a sky. It takes everything I have made over thirty years, from film criticism and opera walks to generative characters and AI products, and places each piece as a star. Stars cluster where the work clusters. Lines run between them where the ideas connect. The result is not a picture of a portfolio. It is the portfolio's structure, made visible.
The Brief
My work lives across ten closely interwoven sites. Each has its own subject and its own voice. Together they hold more than a thousand pieces. Menus and site maps could list them. They could not show what the work has in common.
The Firmament had four jobs:
Show the real shape of the practice. Not a taxonomy imposed after the fact. The actual distribution of thirty years of work.
Make connections the point. The links between an essay on memory and a scored walk and a generative character are the most interesting thing about the corpus. They had to be visible and followable.
Map what should exist, not only what does. Gaps between stars are editorial commissions. A missing connection is the next piece to write.
Work as navigation. A reader must be able to get from the whole sky to any single piece, and from that piece to its neighbors.
Thinking Through Paradigms Before Settling On A Sky
The constellation won because of what a real sky does. Stars sit where they sit. Constellations are patterns people draw between them. That is exactly the relationship between a body of work and the readings made of it.
The hardest problem was not technical. It was the temptation to make the Firmament look like a constellation map instead of work like one. A decorative sky is easy. A structural sky, where position, density and every line carry meaning, is the whole project.
Anatomy Of The Sky
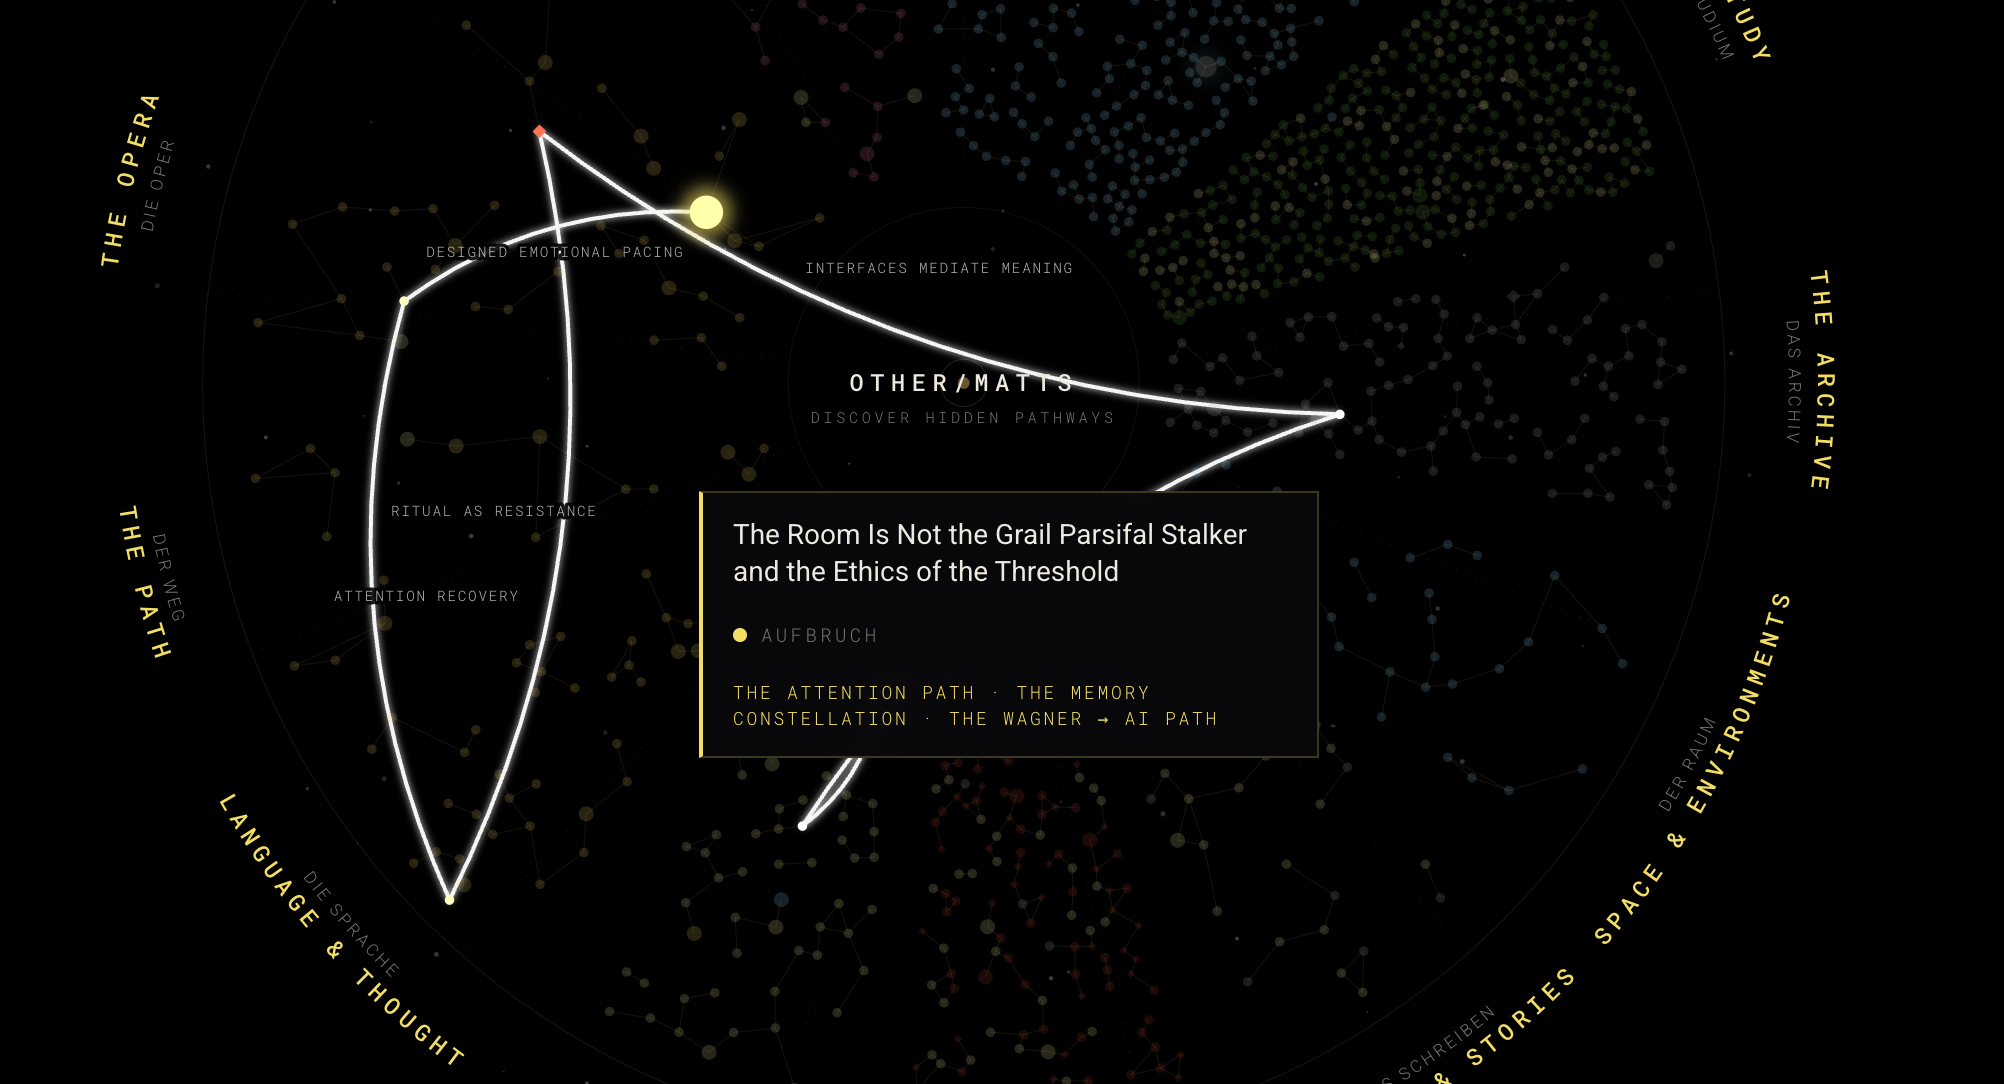
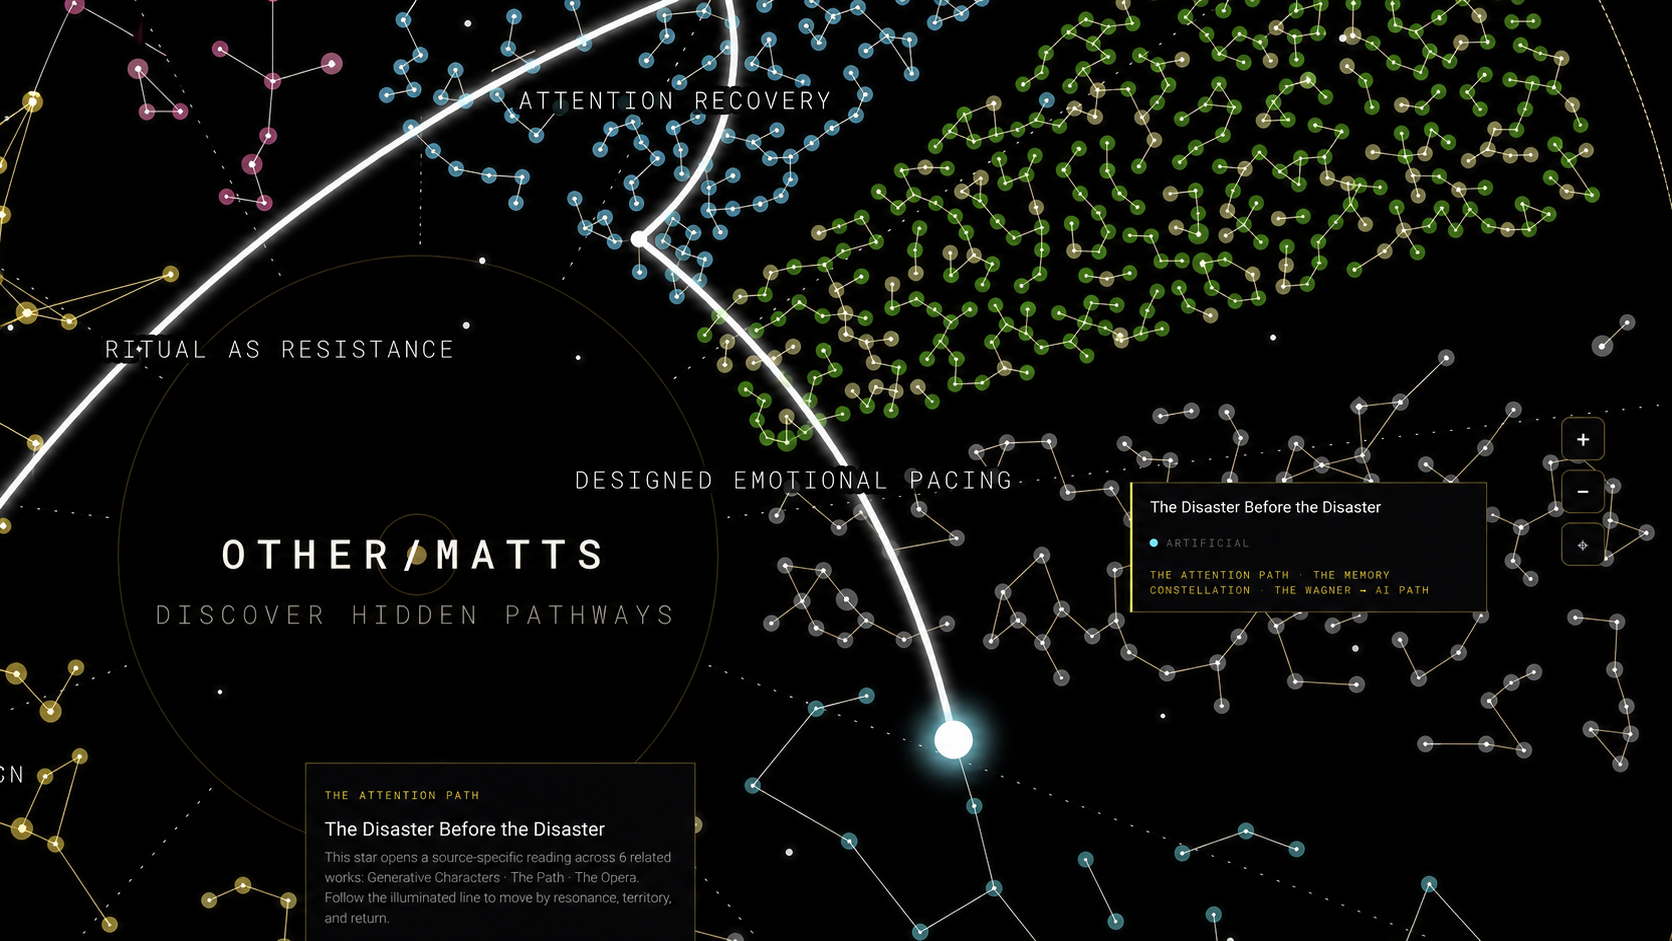
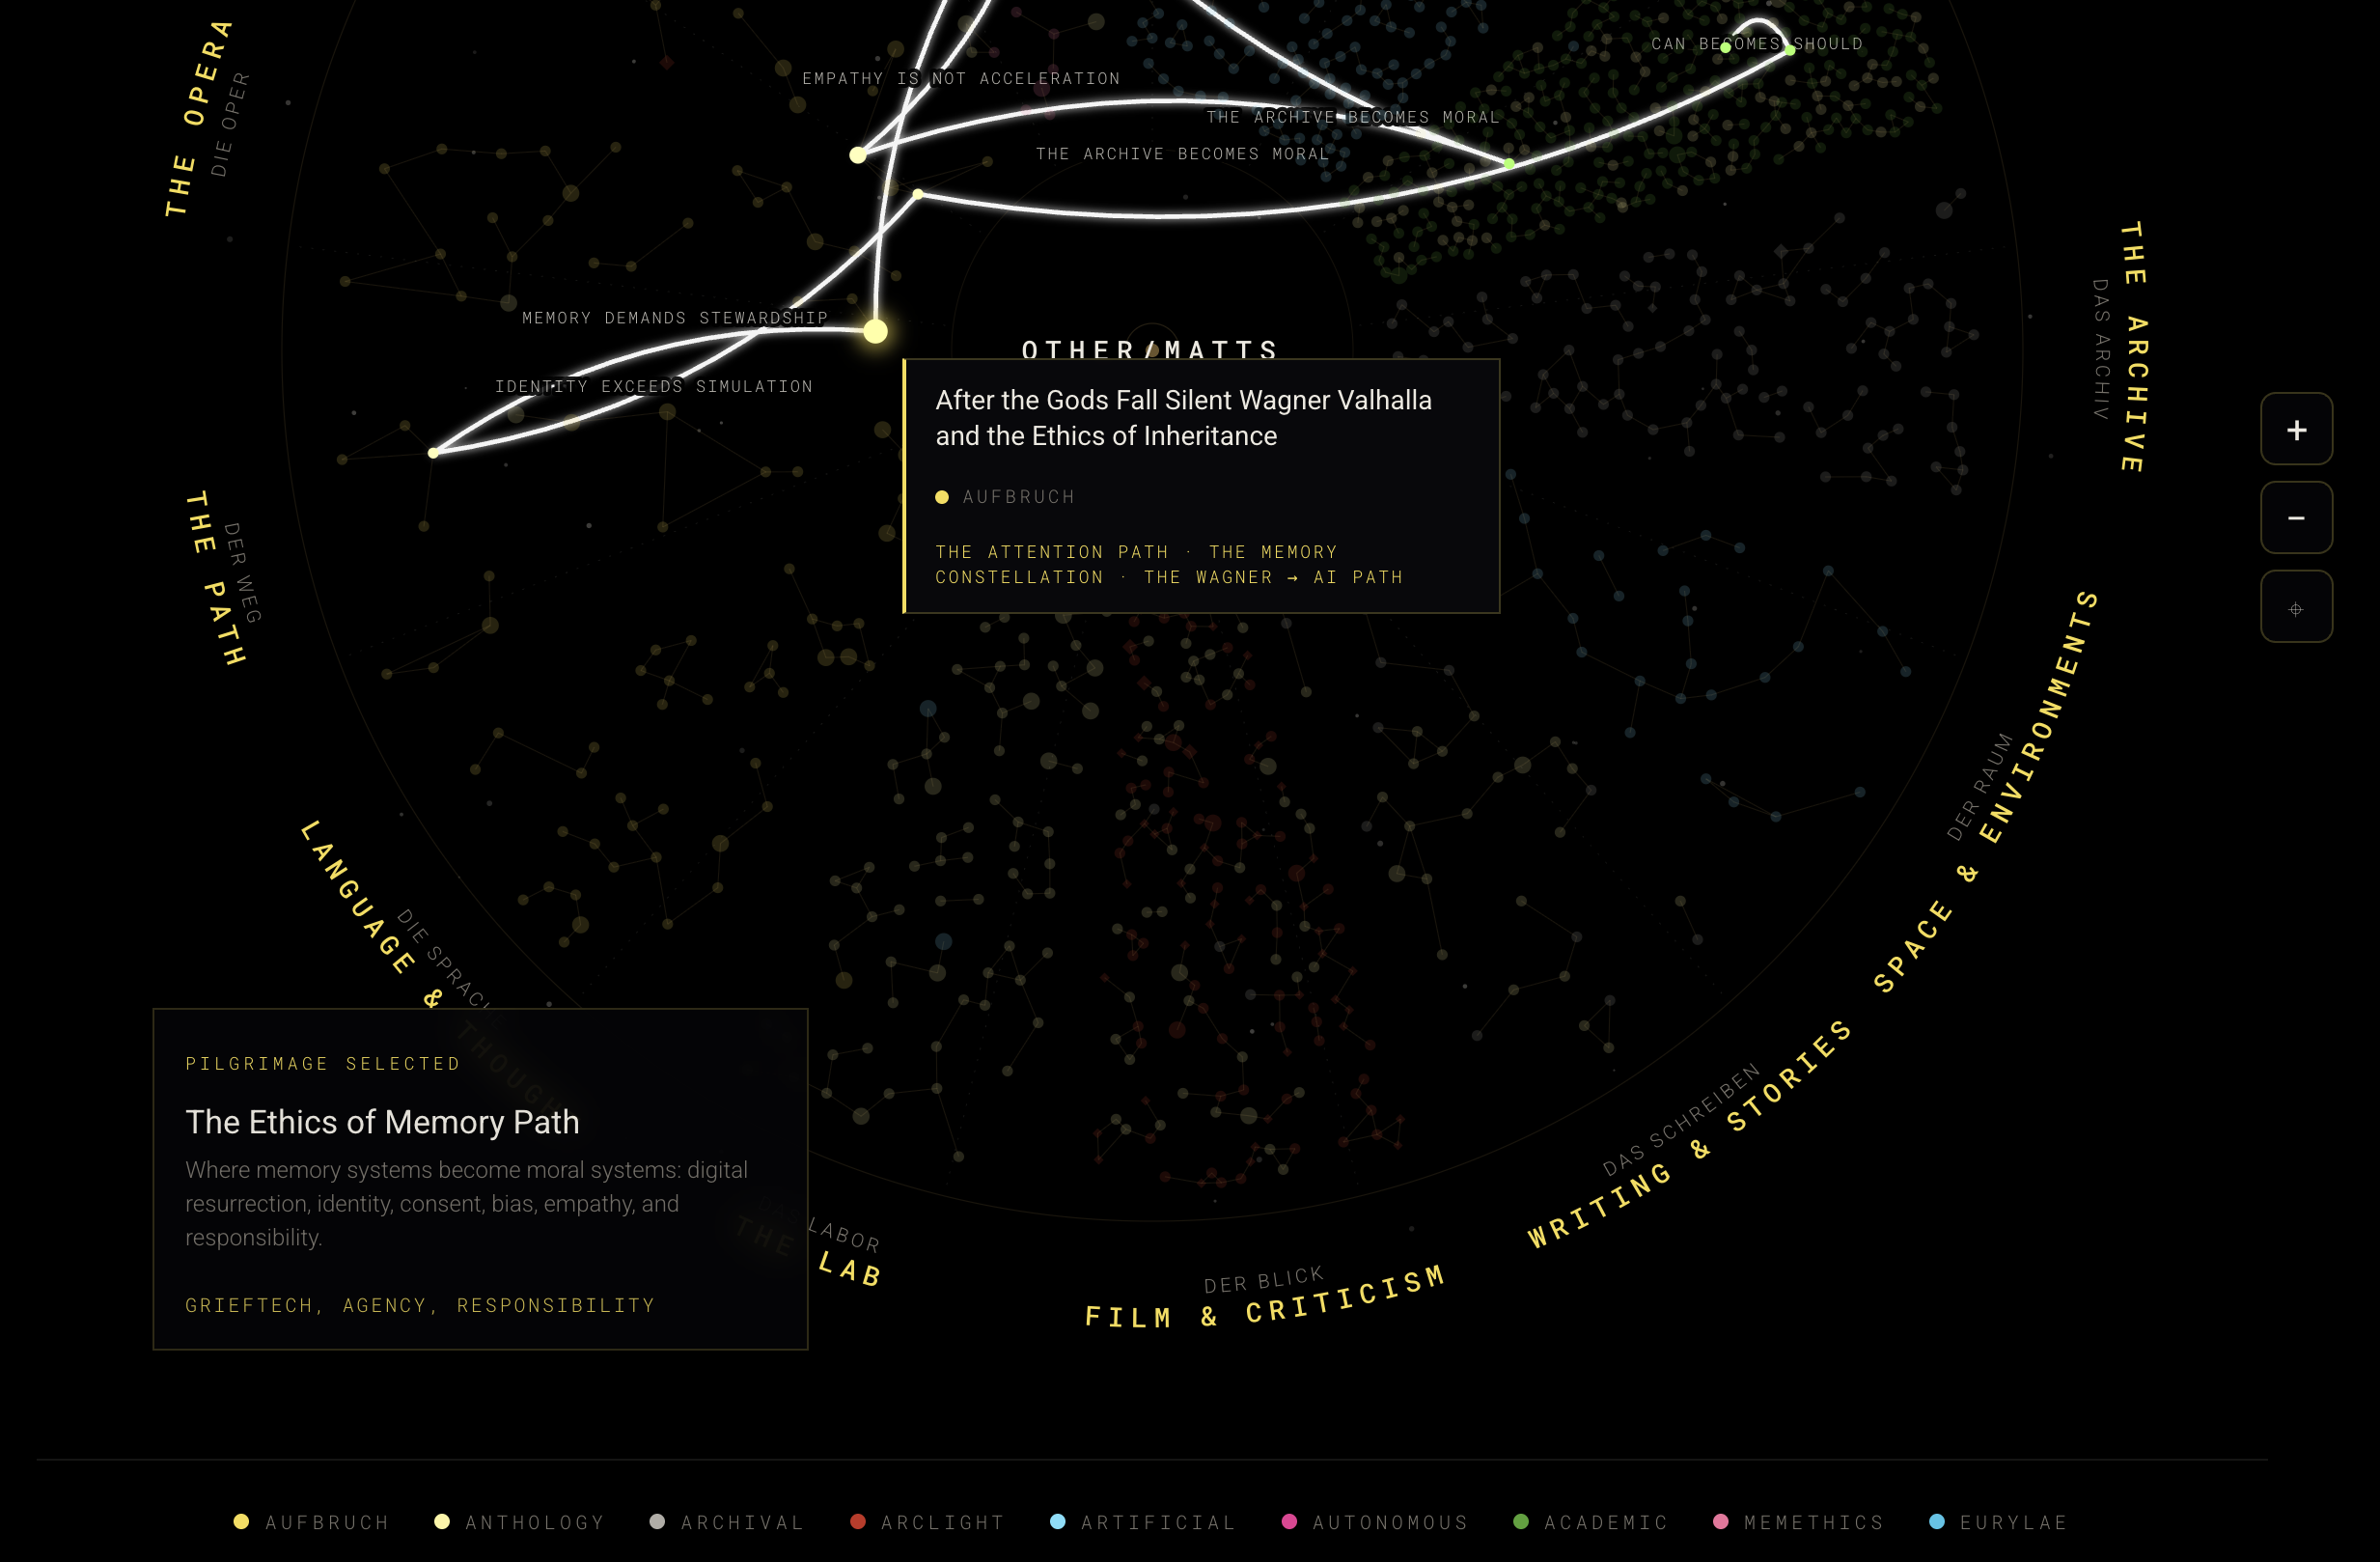
Stars. Each star is one real work. An article, project, essay or archive entry. Hover a star and a card names the piece, its site, and the paths it belongs to.
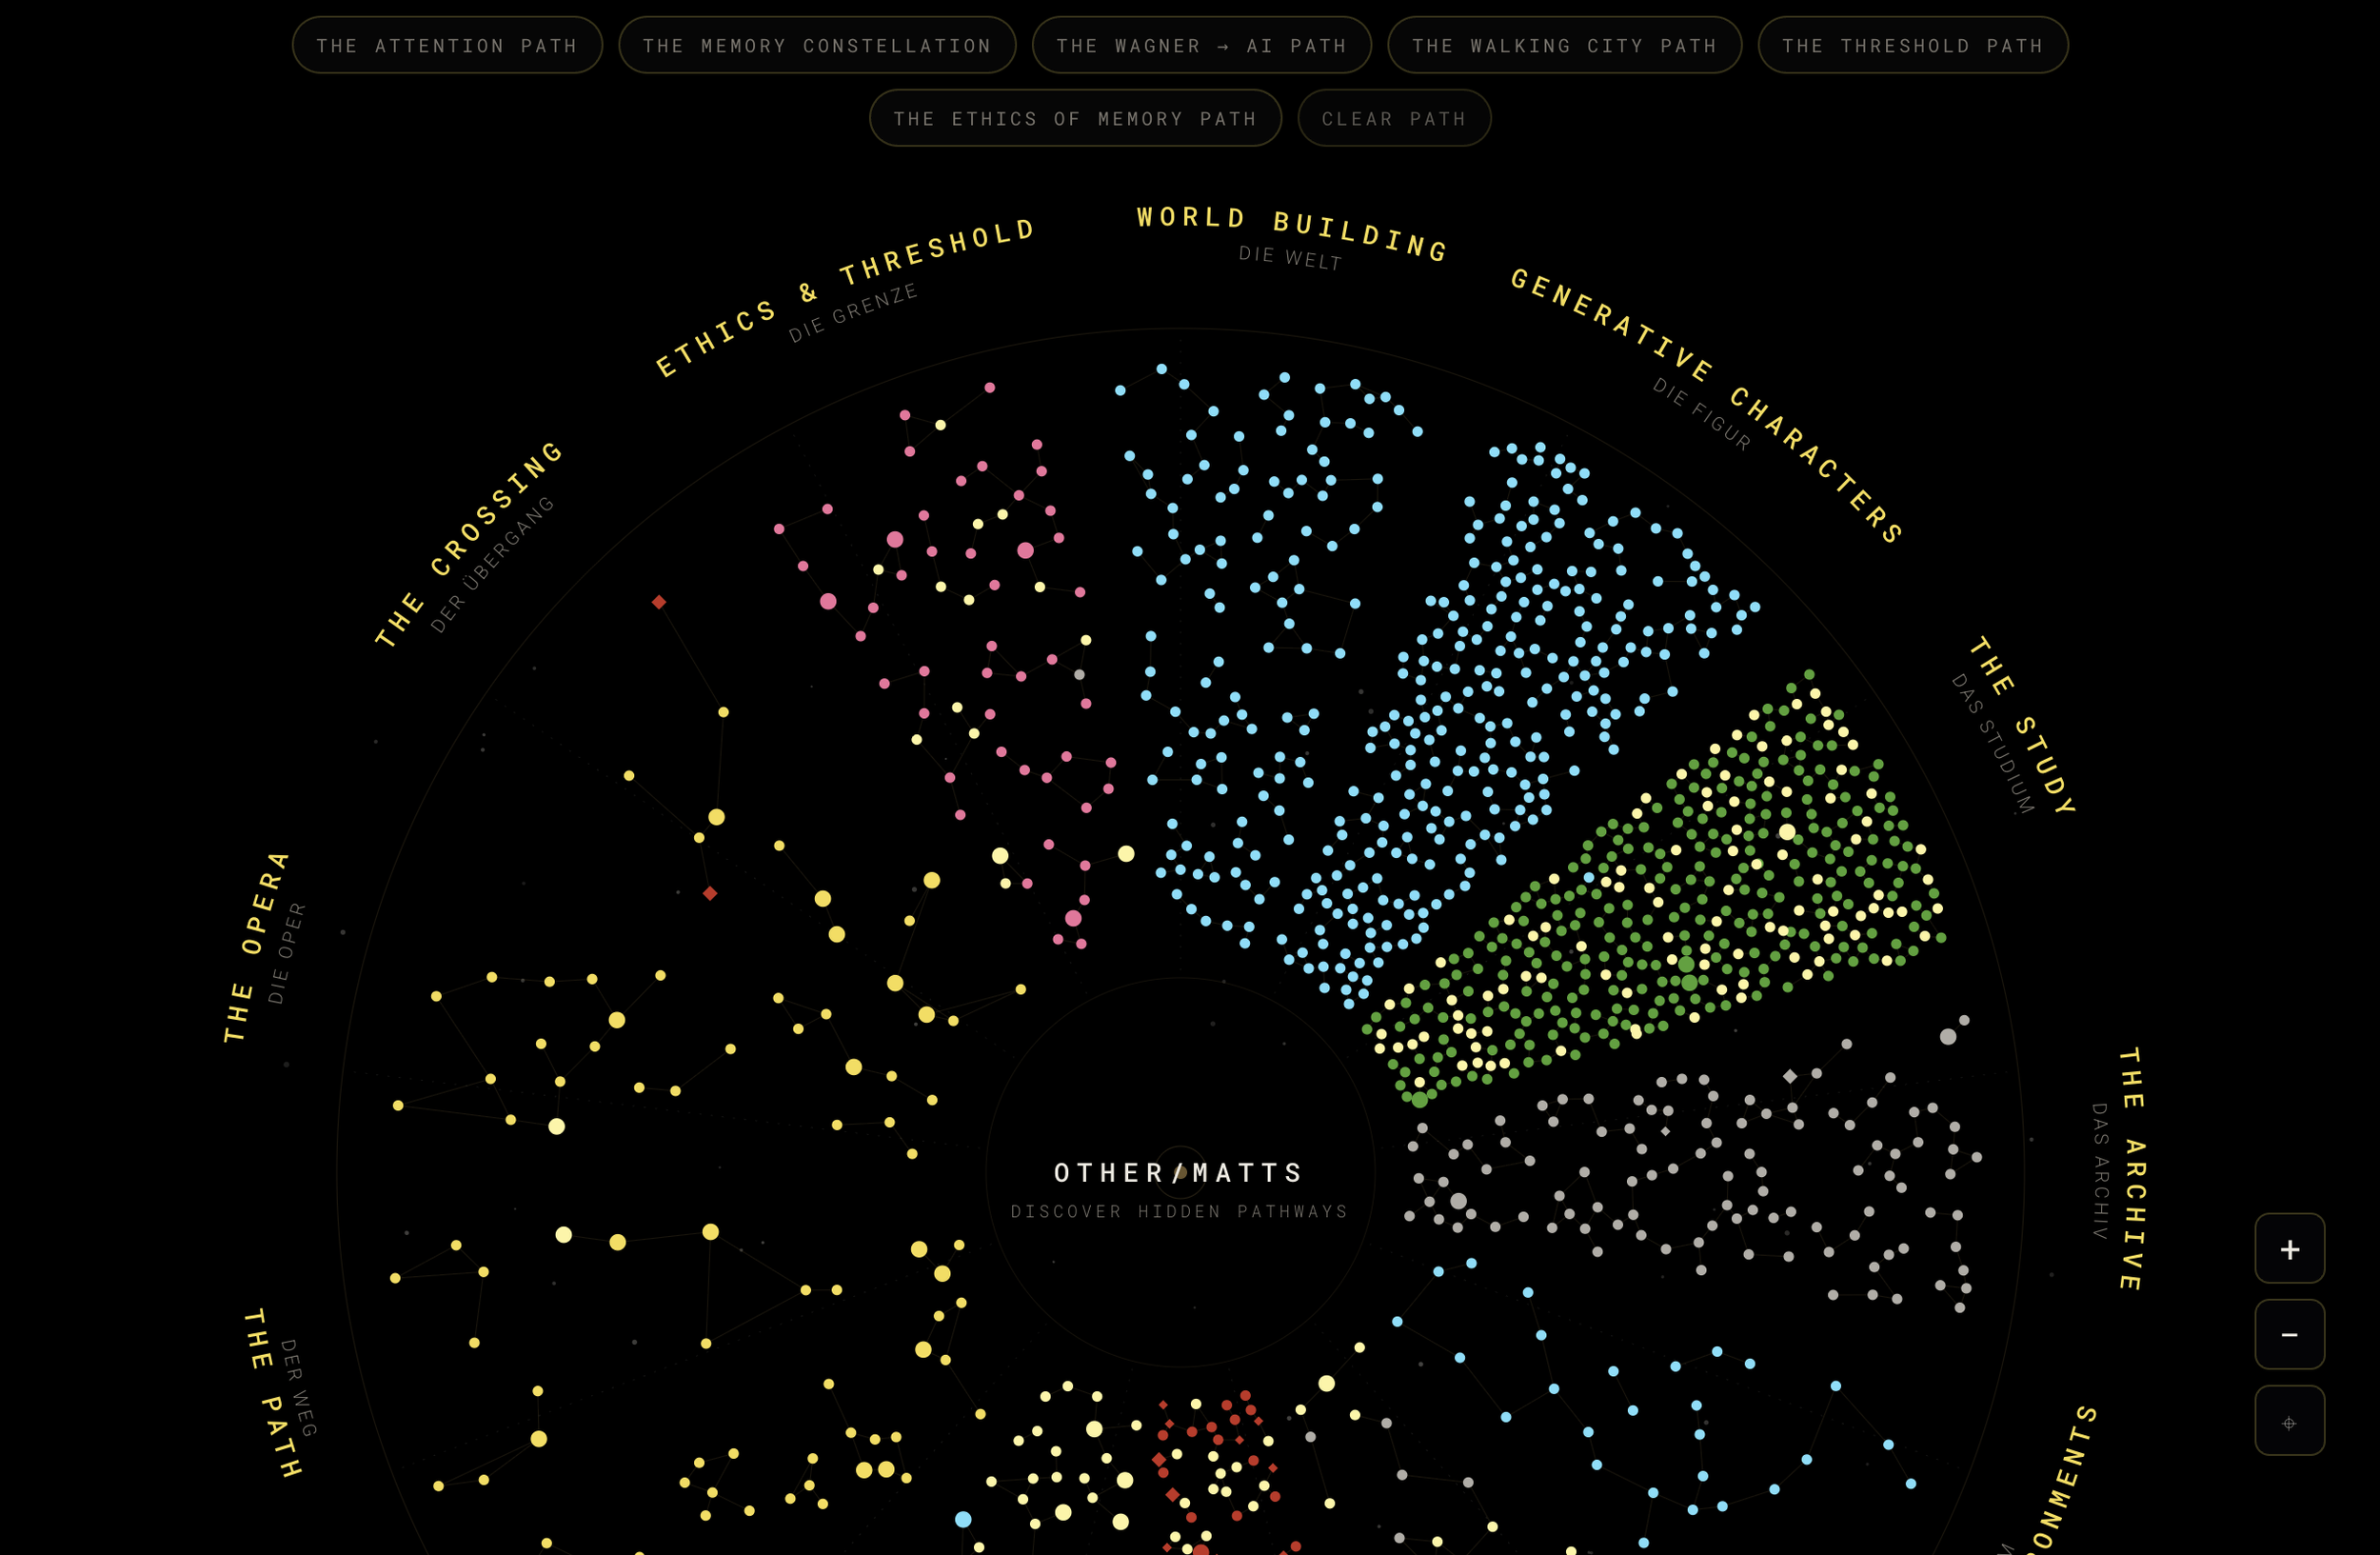
Constellations. Thirteen thematic regions, arranged around the rim, each titled in English and German.
Proximity and density are data, not styling. A constellation is crowded because that part of the practice is crowded. Archival/Matt alone holds more than a thousand entries, and the sky shows it. The data shaped the design.
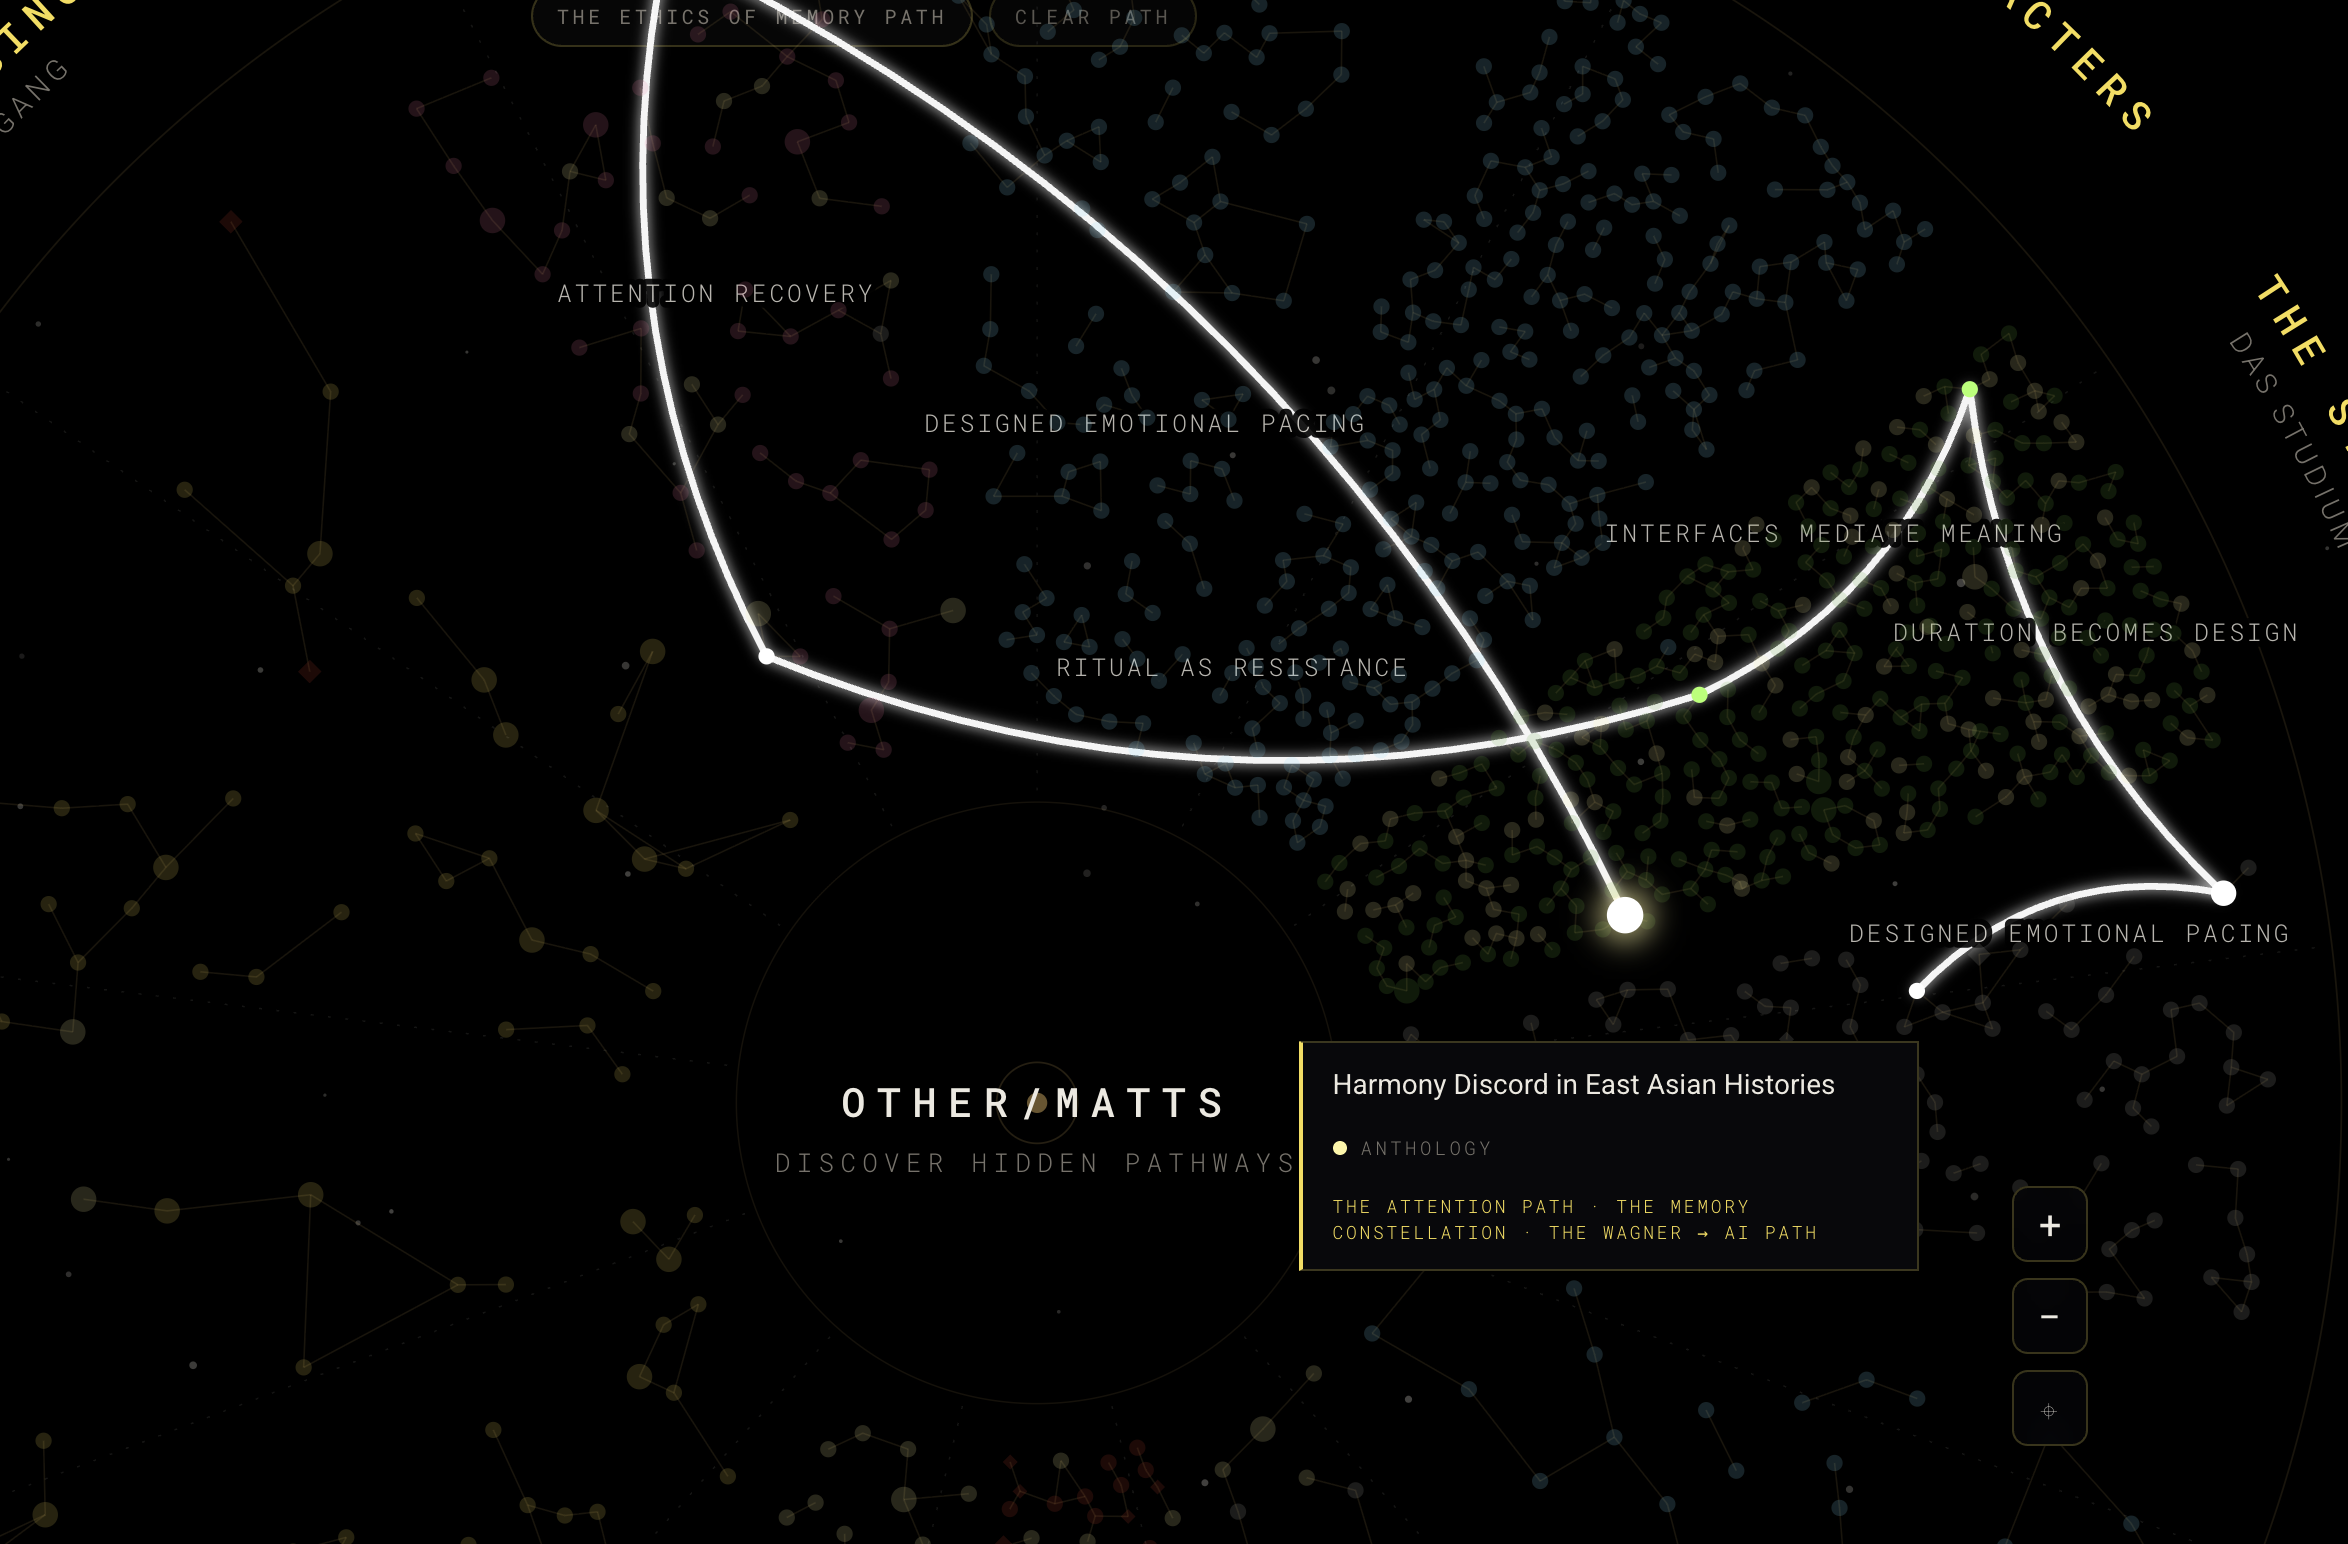
Authored paths. Six readings cut across every constellation: The Attention Path, The Memory Constellation, The Wagner → AI Path, The Walking City Path, The Threshold Path and The Ethics of Memory Path. Choose one and its stars light up, joined by animated pathways. The rest of the sky dims.
The centre. Other/Matts, with one instruction: Discover hidden pathways.
The key. A single panel, headed Contemplative Astronomical Archaeology: "Discover the hidden structures underneath the work. The stars are articles, projects, essays, and archives. The pathways are authored readings: memory, attention, walking, thresholds, systems, and return."
The Technical Build
A hand-built SVG engine. The Firmament is drawn entirely in SVG with plain JavaScript. No canvas, no D3, no charting library. Every star, label, arc and pathway is an SVG element placed by code written for this map. That choice keeps every element addressable: each star can carry its own title, site, paths and link, and each can be styled, animated and hovered on its own.
1,500+ elements without collision. Placing more than twelve hundred points on a radial layout, with no overlap and no visual noise, was the central engineering problem. The answer was layered density calculation. Each constellation gets an angular sector sized to its share of the corpus. Stars are then placed within the sector in layers, so dense regions fill evenly instead of piling up.
Pathways that survive a changing layout. The animated bezier pathways between stars broke repeatedly as the layout evolved. The fix was to rethink how coordinates are calculated relative to the SVG viewport, and to draw pathways only after every star has its final position. The payoff is the whole point of the map. Hidden paths between the work now render correctly, every time.
Curves with meaning. Pathways are bezier curves, not straight lines, so a path crossing the sky reads as a journey rather than a wire. They animate on hover and on path selection.
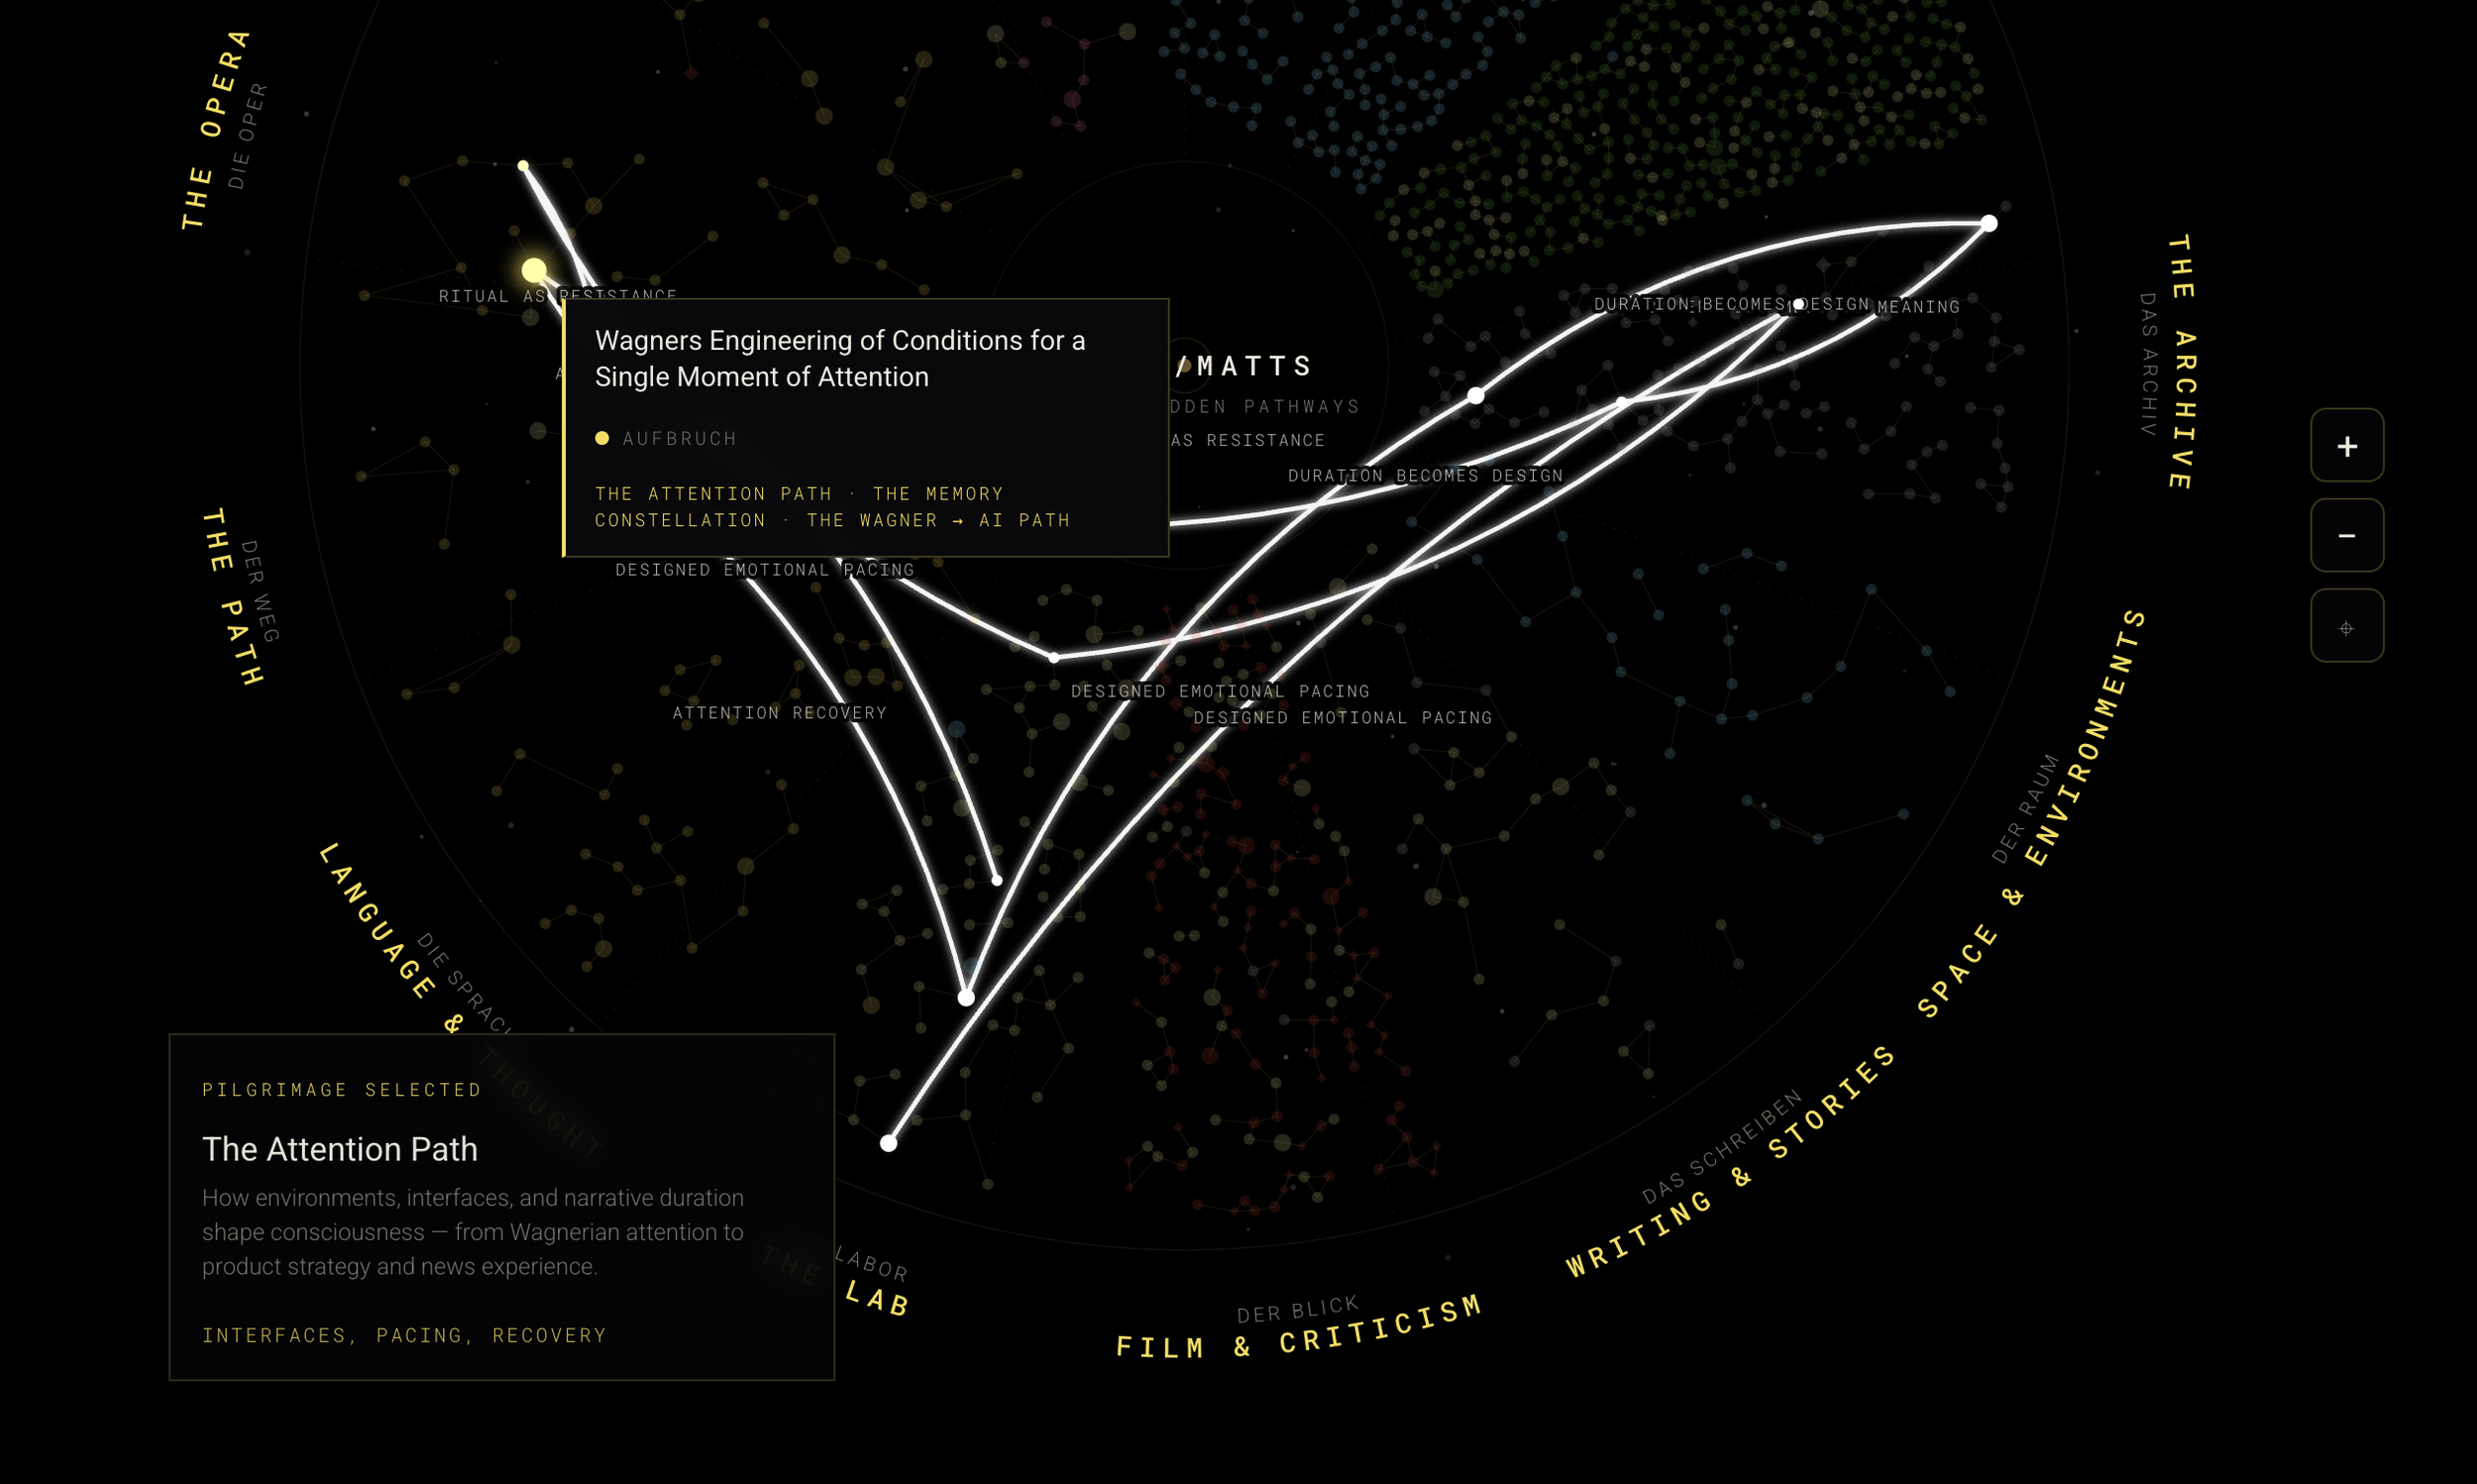
Bilingual type on an arc. Constellation titles run around the rim in English, with the German beneath in a smaller, lighter weight. Roboto and Roboto Mono carry all the type, matching the rest of the constellation.
Navigation built in. Zoom controls, a reset, the path selector along the top, hover cards on every star, and a click through to the piece itself.
Deployed as a product. Not a mockup. The Firmament is the homepage of matthewshadbolt.com and a page on artificialmatt.com, embedded as a self-contained code block. It is the main way into eight live domains.
Versions as design evolution. Each version rethought the underlying visual logic rather than patching the last one. v3 is the flat radial sky. v4 turns it into a dynamic interactive rotating globe.
Building In Dialogue With AI
I am not a developer. I built the Firmament through relentless conversational specification. I described what something should feel like to a reader. I worked backwards from a clear articulation of success. Claude wrote the code. I looked at the SVG output and said what was wrong, visually and experientially. We iterated until the feeling matched.
The skill that mattered was not writing code, but diagnosis. I could see that a pathway landed in the wrong place, or that a cluster felt noisy. The work was turning that into a precise description, then understanding the cause together. Debugging was not a phase after the build. The conversation was the build.
The Firmament proved something I now apply to all my work. One person can hold creative and technical authority at the same time, if the execution is distributed.
What This Shows
The Firmament is information architecture treated as an argument. Its form says something true about its content. That a body of work is not a list but a field of relationships, and that the relationships are where the meaning is.
It shows three things at once. A structural approach to large content sets. Custom data visualization built without leaning on a library. And a working method where one person directs and AI builds, at a level of polish that ships.
Where this applies:
Navigation for large archives, back catalogues and editorial libraries
Visual discovery for brands with years of content and no way to show how it connects
Recirculation: surfacing the next piece by relationship, not recency
Bespoke data visualisation for launches, annual reports and cultural institutions
Portfolio and franchise maps for studios with many titles and one universe
The sky is still being drawn. Some of the most important lines are the ones that do not exist yet. The dark gaps between two stars that belong together. Each one is a piece of work waiting to be made, and the map already knows where it goes.